Running a business means making decisions constantly. Should you hire another employee? Can you afford that equipment? Why are sales up, but profits aren't moving? And how much money do you actually have available to spend?
You could spend hours digging through financial reports to find the answers. Or you could start by paying attention to a few numbers that tell you what matters.
These numbers are called key performance indicators (KPIs), and they can help you understand how your business is performing without getting lost in spreadsheets and reports.
And no, tracking dozens of metrics doesn't automatically make you a better business owner. The trick is knowing which to look at, how often you should and what to do about them.
Luckily for you, here's a quick, practical guide to building a small business KPI dashboard and using it to make better decisions every week.
What Exactly Is A KPI Dashboard?
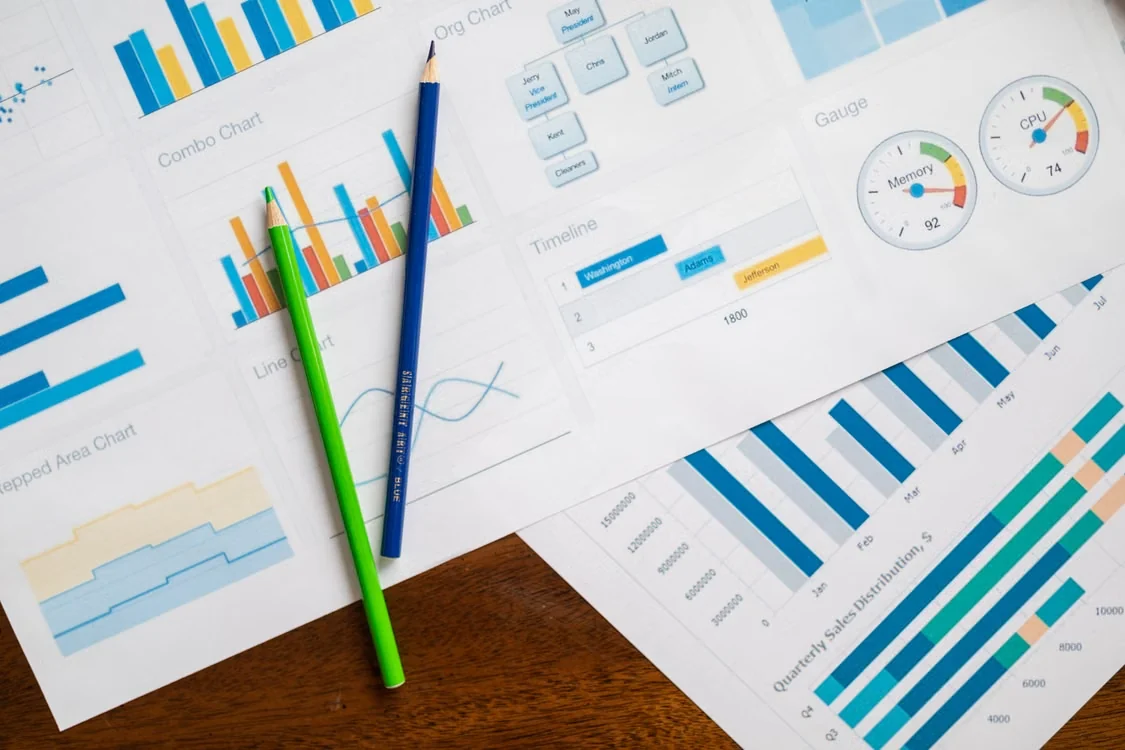
A small business KPI dashboard brings your most important business metrics into one place. That means you can monitor performance without manually reviewing multiple reports. How? By making it easy for you to compare numbers that matter over time and spot changes in trends, allowing you to make informed decisions for your small business.
The KPIs Every Small Business Owner Should Review Weekly
The right KPIs depend on your industry and business model. However, almost every small business will find the following metrics beneficial:
1. Revenue: Are You Meeting Your Targets?
Revenue tells you how much income your business generates from selling products or services, and it goes a long way in helping you monitor sales performance, identify changes and assess whether you're moving towards your targets.
What to look at:
- Weekly revenue compared with your target.
- Revenue compared with the previous week.
- Changes in sales patterns over time.
2. Gross Profit Margin: Are You Keeping Enough Of What You Sell?
Revenue shows what you bring in, while your gross profit margin shows how much remains after deducting the direct costs of the products or services sold.
The math is pretty straightforward:
Gross profit margin = (Revenue - Cost of Goods Sold) ÷ Revenue × 100
Monitor this metric to identify changes in supplier costs, pricing or the direct costs associated with delivering your products and services.
It's worth noting that gross profit doesn't account for your operating costs, and margins vary by industry. That said, we recommend comparing your results with your own historical performance and industry specific benchmarks rather than a universal target.
3. Operating Expenses: Where Is Your Money Going?
Rent, utilities, insurance, software subscriptions, marketing and administrative costs all contribute to the cost of running your business. Reviewing them weekly makes it easier for you to see unusual increases before they compound or become a recurring issue.
Remember, slashing every expense is not the goal. If anything, spending supports growth. What's important is knowing where your money is going and whether the costs are justified by the value they are delivering.
4. Cash Flow: Can You Cover Your Upcoming Obligations?
Profit and cash flow are not the same thing. That's why you can see a business that makes fantastic sales struggle to pay the bills. You might record a sale today but receive payment weeks later; meanwhile, payroll, rent and supplier invoices still need to be paid.
Your cash position tells you how much money is available, while cash flow tracks money moving into and out of your business.
What to look at
- Current cash balances.
- Expected customer payments and overdue invoices.
- Upcoming supplier payments, payroll and other obligations.
- Whether expected cash inflows will cover upcoming expenses.
5. Net Profit Margin: Is Your Business Actually Making Money?
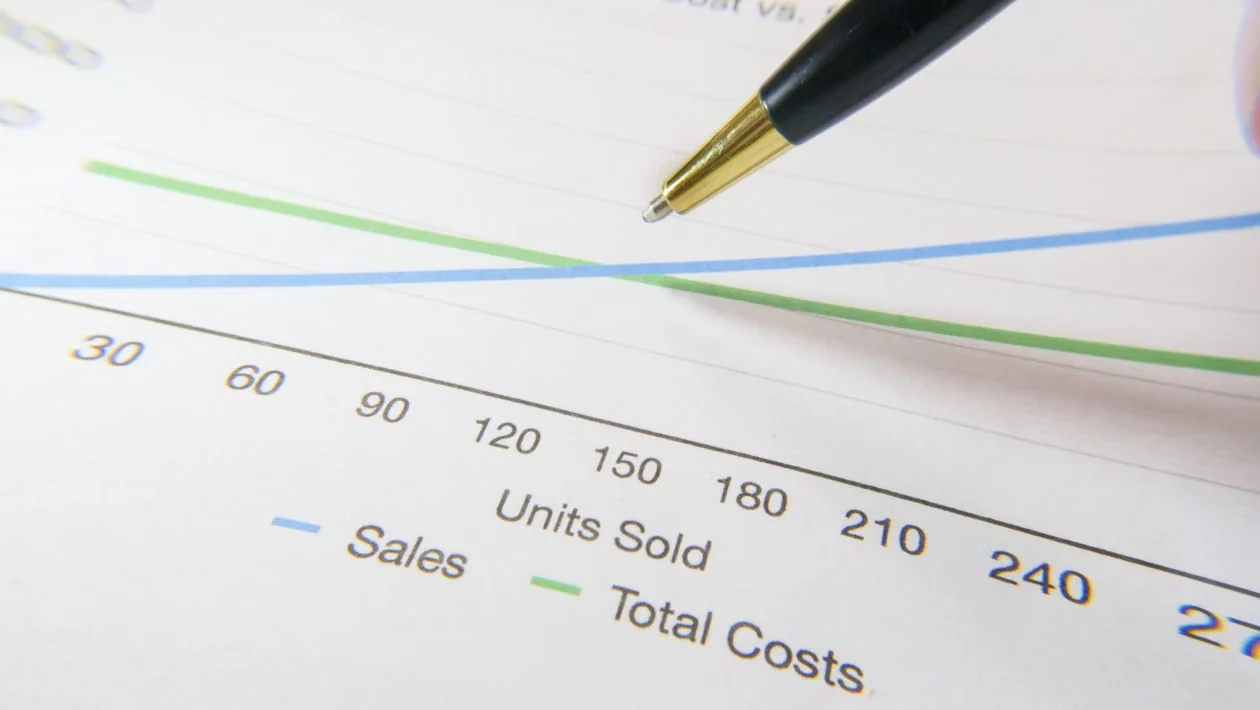
Your net profit margin shows how much profit remains from revenue after expenses are deducted.
The formula:
Net profit margin = Net Profit ÷ Revenue × 100
Reviewing this metric alongside revenue and expenses helps you understand whether your business is becoming more profitable over time. Keep in mind that weekly profit figures can fluctuate, and some expenses are recorded monthly. So, always use reliable, consistently prepared figures and compare equivalent periods before jumping to conclusions.
6. Labour Cost As A Percentage Of Revenue: Is Your Staffing Spend Sustainable?
For businesses with employees, labour costs can have a significant effect on profitability, and monitoring labour costs as a percentage of revenue helps you understand how much of your income goes towards staffing.
Here's how to work it out:
Labour cost percentage = Total Labour Costs ÷ Revenue × 100
A rising percentage doesn't automatically mean you're overspending. Revenue may have fallen, wages may have increased, or the business may have needed additional staff during a busy period. Therefore, always look at labour costs alongside revenue, overtime and staffing requirements to get a clear picture of what's driving the change in the first place.
7. Outstanding Invoices: How Much Money Are Customers Owing You?
Unpaid invoices can quietly create cash flow problems and leave you firefighting when bills need to get paid. That said, if you operate on credit, always review your accounts receivable regularly to identify:
- How much is owed and by whom
- Who's always paying late
- Overdue payments
- Which payments aren't due yet
- Is there a payment you forgot to follow up on
A weekly KPI dashboard review helps you follow up promptly, improve collection practices and plan around expected payments.
How To Turn Your Small Business KPI Dashboard Into Action

Tracking small business KPIs is only useful when the information influences your decisions. Here's how to make your weekly review more effective.
1. Establish A Baseline
Record your starting figures and compare them with previous periods. This helps you distinguish normal fluctuations from meaningful changes.
2. Investigate Unusual Movements.
If expenses rise or profit margins decline, identify the underlying cause before deciding what to do.
3. Choose One Or Two Priorities
You don't need to fix everything at once. Focus on the changes that have the greatest potential impact on your business.
4. Assign An Action
Decide what needs to happen, who is responsible and when you'll review the outcome.
5. Review The Results
At your next check-in, assess whether the action worked or whether further investigation is necessary.
The Takeaway?
You don't need to track every business metric to stay informed. Start with revenue, profit margins, expenses, cash flow, labour costs and outstanding invoices, then build your dashboard around the numbers that support your decisions.
Consistently reviewing metrics that matter will keep you on top of your numbers, allowing you to see what's working, what’s not and what needs to be addressed. After all, a KPI dashboard not only shows you how your business performed; it also empowers you with the information you need to make it perform even better.
Looking for a reliable KPI dashboard for your small business? GoProfitly AI brings KPI dashboard monitoring paired with professional bookkeeping, QuickBooks Online, workforce information with Super Intelligence, financial reporting and AI-powered business intelligence together. Discover what it can do for your business. Start here.
Workforce features, including payroll, scheduling, time & attendance and workforce analysis, require Super Intelligence. Available insights depend on your connected data, records, plan and assigned permissions. AI supports review and judgment; it does not replace them.